|
||||||||||||||
|
Name
Cash Bids
Market Data
News
Ag Commentary
Weather
Resources
|
Can Cash Corn Hit $2.50?
With the end of corn’s 2024-2025 marketing year fast approaching, concluding with the closing bell Friday, August 29, the question of what to expect once the calendar page turns takes center stage. There are a number of ways to put together an outlook, and I’ll be talking about the technical side soon enough. But what about a combination of fundamental and seasonal analysis? This combination paints an interesting picture for 2025-2026. 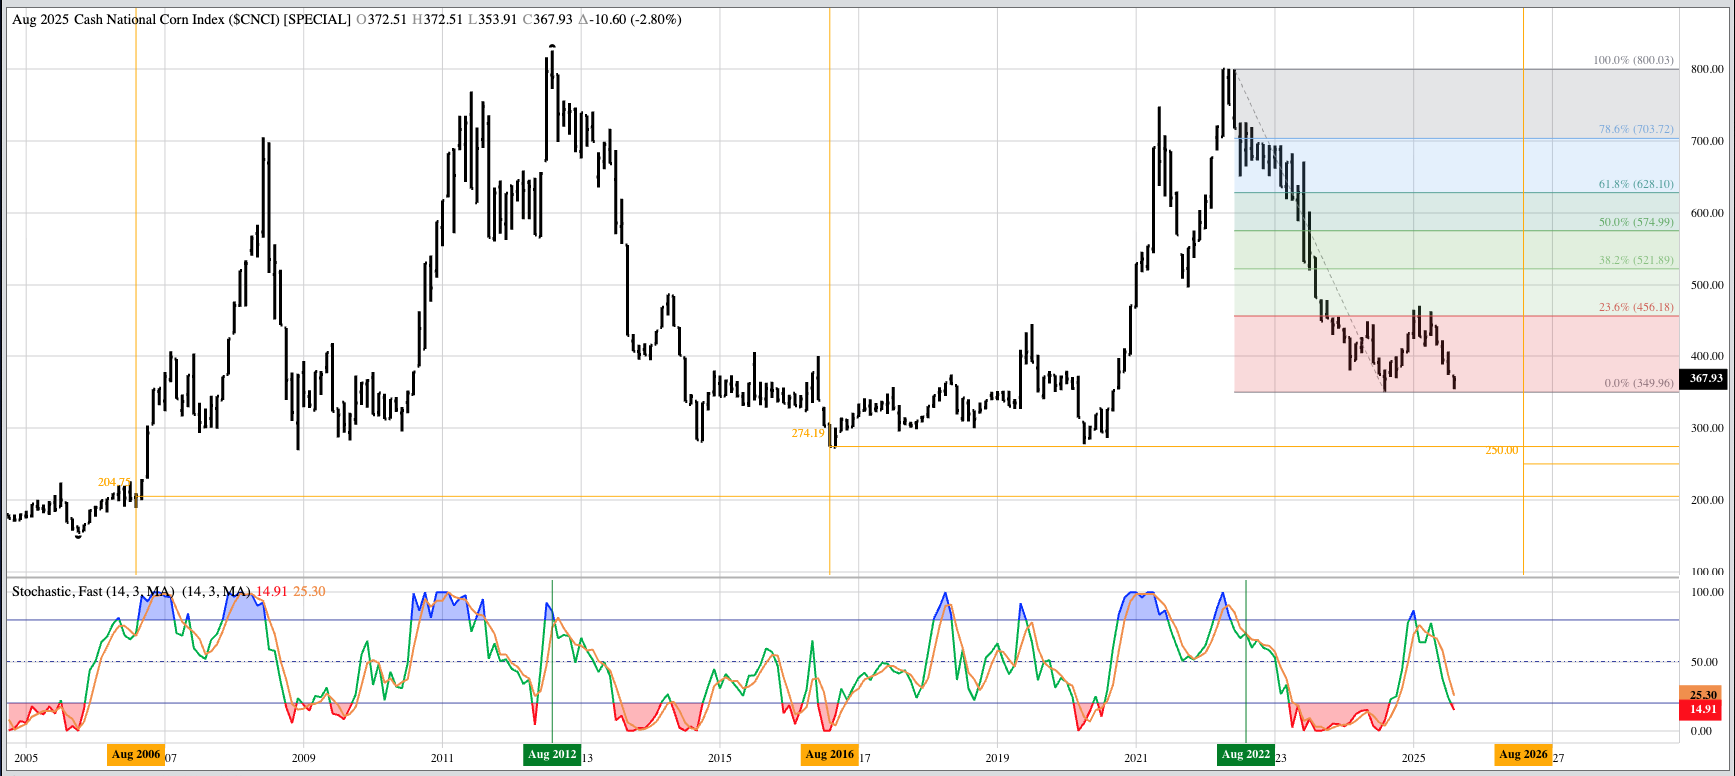 Going back over the past 20 marking years we see a pattern with the National Corn Index ($CNCI), the intrinsic value of the corn market. The Index shows a 10-year pattern, fitting for a market with the characteristic of spending a good deal of time trending sideways.
The previous cycle saw Years 8 and 9 (2013-2014 and 2014-2015) finish at $3.44 and $3.41 (14.1%) before falling to $2.74 and 15.8% at the end of 2015-2016
As a long-term investment market, do I think the National Corn Index is going to lose more than $1 of the coming year? My Blink reaction is “No”. But we’ll see what happens. Stay tuned. 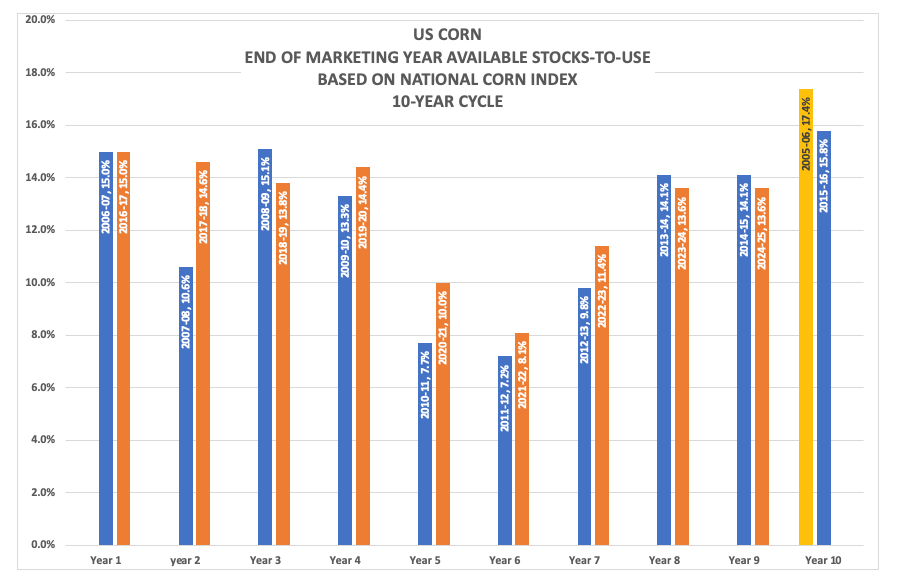 On the date of publication, Darin Newsom did not have (either directly or indirectly) positions in any of the securities mentioned in this article. All information and data in this article is solely for informational purposes. For more information please view the Barchart Disclosure Policy here. |
|
|


