|
||||||||||||||
|
Name
Cash Bids
Market Data
News
Ag Commentary
Weather
Resources
|
Tariffs, Seasonals, and Shutdowns Loom: Why 30-Year Bonds Are Your Next Big Trade!
In August, while traders were relaxing on beaches, the 30-year Treasury yield surged past its shorter-term counterparts, signaling a rare "bear steepener" that has captivated markets. Driven by persistent inflation fears, hefty government borrowing, and fading demand for long-term bonds, this divergence hints at more profound economic shifts. The ripple effects are profound, from a chilling effect on the housing market to mounting challenges for the Federal Reserve. Read on to uncover the forces behind this phenomenon and what it means for the economy's future. Several factors contributed to the 30-year Treasury yield diverging higher than its shorter-term peers during August. Key drivers of the divergence:Long-term inflation expectations: Despite short-term inflation data being relatively mild, but now going away from the Feds 2% target rate, investors are increasingly concerned about the persistence of inflation over the long run. This is fueled by several factors, including:
Heavy supply of long-term debt: The U.S. government's high budget deficits require frequent and extensive Treasury debt auctions to fund operations. Even after the U.S. Treasury agreed to use short-term T-Bills to do a bulk of the refinancing, the long end of the curve is not convinced that it is enough. Weak demand at recent 10- and 30-year bond auctions in early August, as investors demanded higher yields, drove bond prices down and yields up. Growing term premium and fiscal concerns: The term premium, or the extra compensation investors require to hold long-term bonds, has been rising. This is tied to uncertainty about the future path of inflation and concerns over the U.S. national debt. Moody's downgrading of the U.S. credit rating in May further eroded confidence and increased the perceived risk of holding long-term debt. Federal Reserve policy expectations: While short-term yields declined based on expectations for a new cycle of Fed rate cuts beginning in September, the longer-term outlook is more complex. Investors are concerned that potential Fed policy decisions might not be enough to contain long-term inflation, contributing to higher long-term yields. Diminishing demand from global investors: In mid-2025, U.S. Treasury auctions saw unusually low foreign participation. This trend, some analysts believe, signals broader concerns among international buyers, further exacerbating the supply-demand imbalance and pushing higher yields. Technical Picture of the Bear Steepener
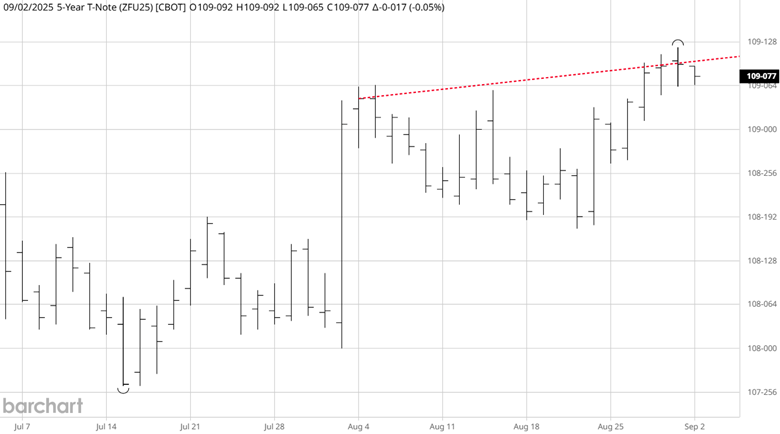
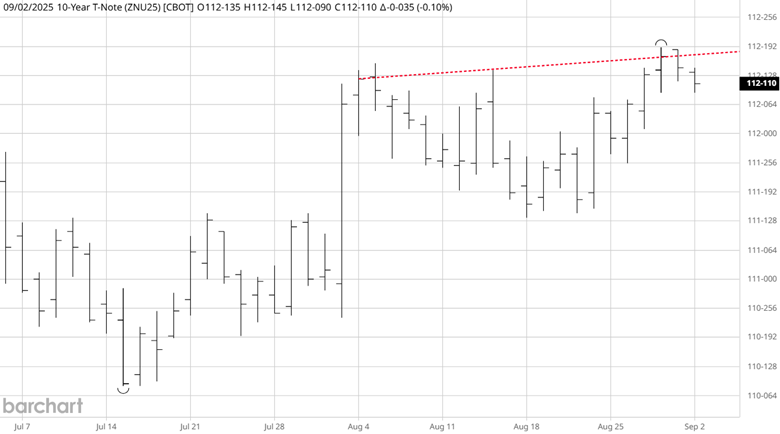
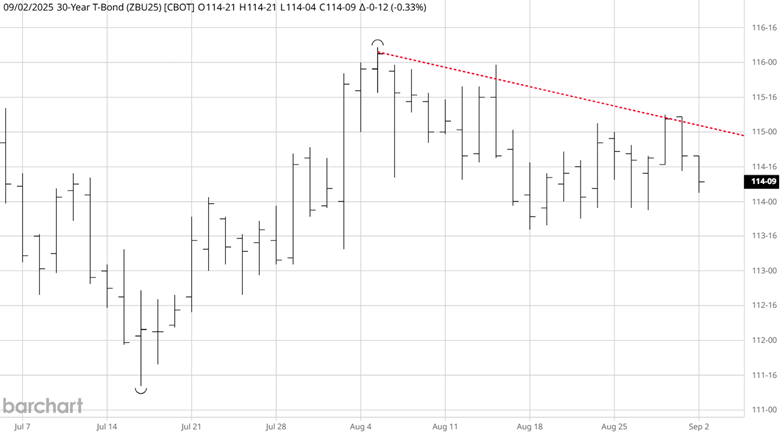
Source: Barchart The daily charts illustrate the bear steepener. These charts are based on the price of the futures contract. Higher prices equal lower yields, and lower prices equal higher yields. Since early August, the 5 & 10-year note charts have been trading higher. In contrast, the 30-year bond chart has been trending lower (higher yields). There is a distinctive divergence occurring. The question becomes, will it continue? Consequences of the Divergence
Seasonal Pattern
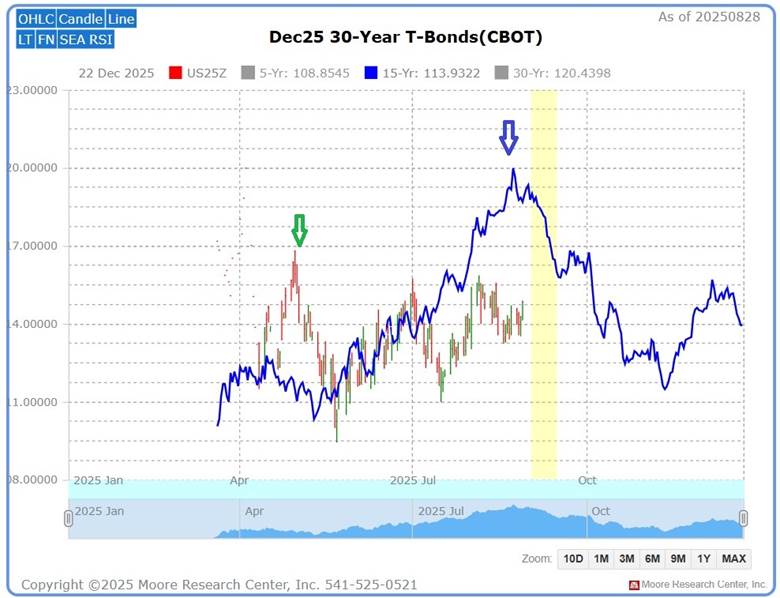
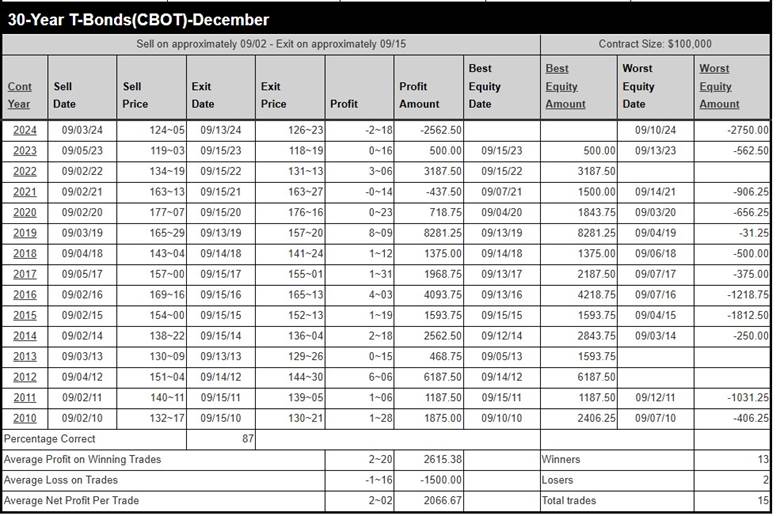
Source: Moore Research Center, Inc. (MRCI) The previous fundamental and technical events may provide a tailwind to the upcoming MRCI seasonal sell pattern for the 30-year Treasury bond futures. MRCI research has found that the December 30-year Treasury bond contract has made its seasonal high during August for the past 15 years (blue arrow). In contrast, this year the seasonal high appears to have come in April (green arrow). The April highs have been tested and have failed twice since forming. This creates a seasonal divergence and possibly signals weakness in the 30-year bond contract prices. MRCI research has found the 30-year bond has closed lower on approximately September 15 than it did on September 02 for 13 of the past 15 years, an 87% occurrence rate. During this period, three years did not sustain a daily closing drawdown. During hypothetical back testing, the average net profit per trade was 2-02 points, $2062.50.
Source: MRCI As a crucial reminder, while seasonal patterns can provide valuable insights, they should not be the basis for trading decisions. Traders must consider various technical and fundamental indicators, risk management strategies, and market conditions to make informed and balanced trading decisions. Assets to Trade the 30-Year BondThe CME Group's 30-year U.S. Treasury Bond Futures (ZB) and the iShares 20+ Year Treasury Bond ETF (TLT) offer investors distinct ways to gain exposure to long-term U.S. Treasury securities. ZB futures, traded on the CME Globex platform, have a tick value of $31.25 per 1/32nd of a point, with a notional value of $100,000, and operate nearly continuously from Sunday 5:00 p.m. to Friday 4:00 p.m. CT, reducing gap risk by allowing traders to respond to market events in near real-time. In contrast, the TLT ETF, tracking the ICE U.S. Treasury 20+ Year Bond Index, trades on NASDAQ with a share price around $86.60 (as of September 1, 2025) and no fixed tick value, as it fluctuates like a stock, but is limited to regular stock market trading hours, 6.5 hours per day, increasing potential gap risk overnight. The ZB's extended trading hours provide greater flexibility for managing interest rate exposure compared to TLT's standard trading schedule. In Closing…As the 30-year Treasury yield's surge in August underscores a pivotal "bear steepener," the economic landscape faces significant challenges, from strained housing markets to complex Federal Reserve decisions. With tools like the CME Group's 30-year Treasury Bond Futures (ZB), offering a $31.25 tick value and 23-hour trading to minimize gap risk, and the iShares TLT ETF, trading at $86.60 with standard market hours, investors have options to navigate this volatility. The seasonal sell pattern looming in September, backed by 15 years of historical data research from MRCI, suggests potential further declines in bond prices. Dive deeper into these dynamics to understand how to position yourself in this shifting market. On the date of publication, Don Dawson did not have (either directly or indirectly) positions in any of the securities mentioned in this article. All information and data in this article is solely for informational purposes. For more information please view the Barchart Disclosure Policy here. |
|
|